


If there’s a follow-up question, I will go on to explain that we accomplish this by carefully generating accurate forecasts with creative schedules, and then we track all of that in real-time and report back on our progress. There’s a lot that goes into a functioning workforce management (WFM) plan.
But that all gets boiled down into a single question: “Do we have enough people to make our service goal next Tuesday at 3 pm?”
When you can definitively answer that question, then you know WFM. There’s usually a laundry list of obstacles standing in your way to the answer. Things like missing data, shrinkage assumptions, stale forecasts, schedule rules, handle time questions, attrition, utilization (or is it occupancy?), adherence-compliance-conformance, then understanding the difference between adherence-compliance-conformance, and the list goes on…
These are extra things we build into our plan to arrive at the correct answer. If next Tuesday’s handle time forecast isn’t up to date with recent changes, I may have the right number of calls predicted, but the workload will be wrong, which means the utilization rate, which is a derivative of workload, will also be wrong. Then the shrinkage factor will be wrong, which means any schedule optimization efforts might do us more harm than good.
And before we ask an agent to do something that will potentially disrupt their life, like changing their lunchtime or asking them to stay late, we should at least qualify that what we are asking them to do will truly solve our problem.
When you understand the group, you can anticipate what the needs are, which pain points hurt the most, and how you can help.
Once we trust how we look next Tuesday at 3 pm, we can also see how we look next week and if we’re positioned to meet service goals for the rest of the month and the rest of the year. Knowing this answer shows when we need to hire more people or when we already have too many people, so we can allow attrition to occur naturally without immediately re-hiring.
And it all begins with building a strong forecast.
The forecast is critical because it tells us what kind of work we’re doing, how much work we have, how long it will take to complete, how these service goals are defined, and ultimately, how many people we need.
This flowchart is a diagram that represents each step in the forecasting process. (See Figure 1).
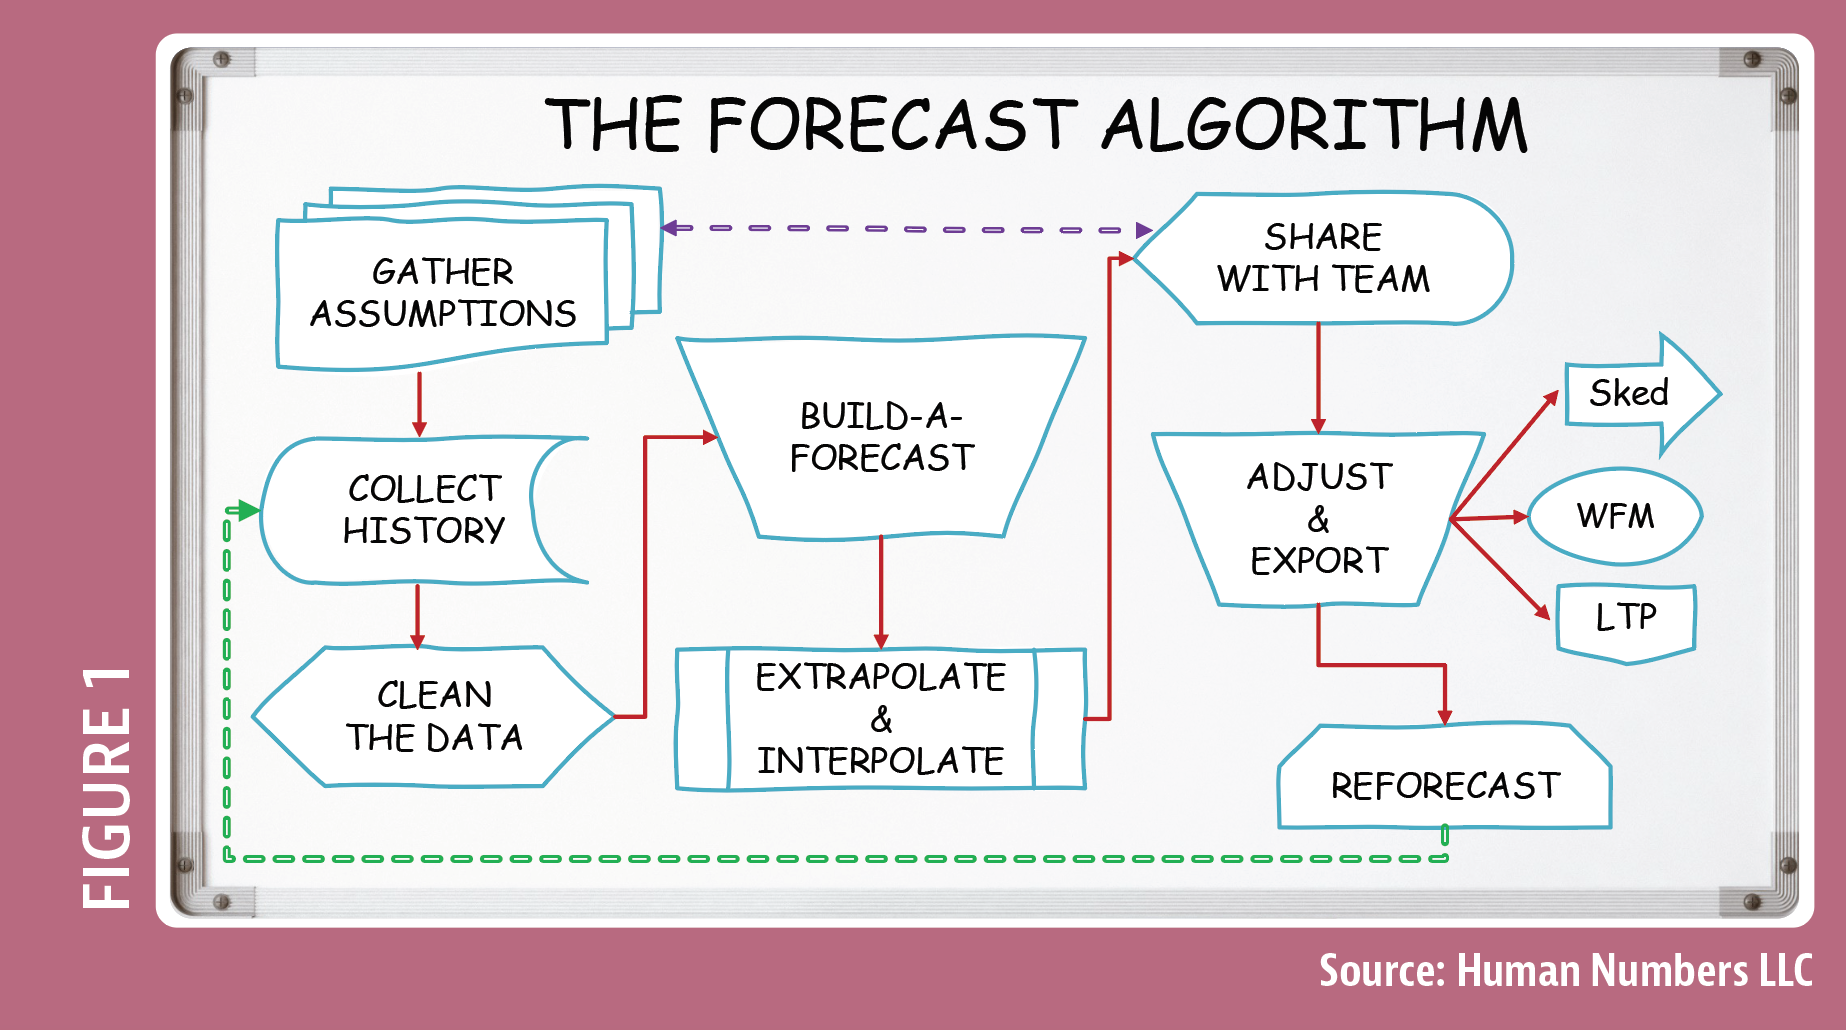
The first thing I do is Gather the Assumptions that apply to the forecast group. These are the pre-existing rules and conditions that exist, as well as the goals and expectations about what’s going to happen next.
Take operating hours, for example. If the center is open from 8 am to 5 pm, I won’t deliver a forecast that begins at 7 am because that doesn’t meet the requirements. But, if someone asks how much extra headcount is needed if we were to extend operating hours, then I would run two forecasts side-by-side for comparison.
Gathering assumptions means the Forecaster performs the due diligence needed to get themselves up to speed on the group they’re working with. The icon in my forecast process represents a multi-document because sometimes these assumptions live in different places.
The source for your company’s mission statement is probably different than the source for your IVR phone tree, and you need to know both of those things when building a forecast. This is something we, as Forecasters, need to seek out and get for ourselves because it puts us in a stronger position to succeed. When you understand the group, you can anticipate what the needs are, which pain points hurt the most, and how you can help.
The second step is Collecting History from the stored data. I want to build a forecast that represents true demand and acceptable risk. That forecast is based on normalized, offered volume, which means the volume we’d like to answer during hours we’ve agreed to be open, plus the acceptable abandons we’re willing to lose. But I also want a forecast that represents my actual reality.
If I’m severely understaffed, I already know I’m going to see extra repeat callers because of customers who hang up and repeatedly call back. This appears as inflated volume. But it’s not inflated demand: it is extra volume showing up in the form of extra noise because I’m understaffed.
We need to have a way to distinguish between the actual signal of the true, legitimate demand in the raw data versus extra noise from repeat callers.
This is why the third preparation step, Cleaning the Data, is so important. This step applies to every single interval of history in every one of my active forecasts. During this cleaning, 1 of 4 things will happen:
1. If I have previous knowledge of something externally impacting my raw data and I’m not expecting a repeating occurrence (for example, a random system outage), I can normalize it by adjusting volumes up or down to bring them back to normal levels.
2. I could tag it with a special category for days happening on or around holidays. The Friday before Memorial Day is different than a normal Friday. The total daily volume is different, and the times people call are different. As is the Tuesday after Memorial Day. A Tuesday morning that follows a Monday holiday usually sees a larger surge than a regular Tuesday.
These days get put into their own day-of-week category AND their own time-of-day category so they can be reused for future holidays while staying far away from my normal, non-holiday patterns.
3. Sometimes, I just need to wipe it out. This happens when there is an irregular situation that I don’t need to preserve for a future forecasting model. For example, marketing made a mistake and sent a mailer with inappropriate content, which generated a lot of extra calls. The problem has been fixed, apologies have been made, and it won’t happen again.
4. Everything else that can be validated is allowed to stay in, where it is cataloged and organically absorbed into the natural forecasting process, where it becomes the new pattern.
#1 Best Practice for a Better Forecast: Clean all the abandons at the interval level down to a number matching the acceptable abandonment goal.
We need to have a way to distinguish between the actual signal of the true, legitimate demand in the raw data versus extra noise from repeat callers.
A good starting point is to clean out all abandoned volume exceeding the acceptable abandonment goal. It is ridiculous how remarkably well this simple little method works for normalizing volume in a contact center. Cleaning data this way and then using that as the forecasting baseline will almost always instantly produce a better demand forecast when you are fighting against understaffing.
Your final scrub may work better with a deeper cut on abandons, depending on your individual setup (Virtual Call Backs and DeQueued/ReQueued configurations may need less of a cut). You could do this same kind of cleaning step at the daily level or the weekly level, but when you start summarizing data, you lose visibility in the averages, so the cleaning is less effective here than at the interval level.
Now that we’ve defined the demand and have identified where that data lives, we can Build a Forecast (the fourth step). The trapezoid shape in my diagram indicates this is an operation performed manually and by a human.
My forecast is one of total freedom, built in Excel with complete control over forecasting methodology, but even when you’re building your forecast using WFM software, you still need to make some human choices about which growth rate you want it to use, which holidays you want it to treat differently, which campaigns it’s allowed to run, etc.
Let’s briefly look at AI (artificial intelligence). AI in forecasting is like AI everywhere else: it’s not actual free-thinking intelligence, but rather an advanced program following a human’s predefined set of criteria (think very advanced if-then statements).
Your forecasting software will benefit when its human overlord instructs it to use the Fibonacci spiral when we expect serious exponential growth. You’ll probably also need to tell it when to stop using such an aggressive approach and return to normal.
The fifth step in the Forecast Algorithm, Extrapolate & Interpolate, is mechanical. Days must be turned into weeks, and weeks turned into months.
I like building my forecast at the weekly level and then extrapolating that down to intervals using day-of-week and time-of-day factors. Then I interpolate the daily values up to monthly and annual numbers, which can be consumed in the bite-sized increments that management likes.
Asking our managers to sit back and patiently take 52 bites of weekly-level data is too big of a meal for some people, especially if they’re not used to looking at weekly plans. And the idea of taking 365 bites of daily information is too much. But asking them to sit down and take 12 bites of monthly data is more reasonable, allowing us to fit an entire year on a single plate.
Next, I’m ready to Share the Results, the sixth step, with the rest of the team. I selected a display symbol because I want to put this data on display for people to read, like a monitor or a projector screen. This step also calls back to the original step – Gather Assumptions, because your audience may decide to change some assumptions when they see the final headcount.
When sharing a forecast with your schedule team…They’ll want it converted into required staff numbers…
This is our big opportunity to validate those original assumptions. When presenting work to an outside audience, we want to make sure we give them enough information to support our conclusions.
Those are all the building blocks behind the forecast, and now it’s time to ask the external team: “How do you feel about this forecast? Is it too high or too low? Do you want to see any changes?” Remember, the volume is what drives the requirements, which tells us how many people we need and if we have enough to meet our service goals. This is the time to solicit their ideas and feedback about what’s happening next.
The seventh step, Adjust & Export, is another operation that sends our forecast out to its final destination, whether it’s the scheduling team, exported into WFM software, or landing in a long-term plan where it will be used to develop hiring plans and make strategic decisions.
When sharing a forecast with your schedule team, they’ll need more than just volumes. They’ll want it converted into required staff numbers, and for that, you’ll need to incorporate a utilization rate or response time factor.
The eighth and final step, Reforecast, is a loop that sends us all the way back to step #2, Collect History. The forecast I build is created at the weekly level, which means every Monday, I’ll pull in new history for the previous week and reforecast everything with fresh new growth rates, trends, and patterns, which restarts the entire cycle.

There are some situations where a group has such a stable and predictable customer base that my re-forecasting process only needs to happen a few times a year. Other groups are so volatile that they require a midday refresh on both volumes and handle time forecasts. Step #3, Clean the Data, is usually the point in the forecasting process where I can identify how frequently that group will need to be treated.
Each forecast group has its own personality, which is why I learned never to take forecast accuracy personally. Forecast accuracy shows me the calls behaved the way I expected them to, or they didn’t, and besides, there are much better metrics to evaluate how well a Forecaster is doing their job.
I know this was a lot, and it’s always easier to show someone how to do this rather than just telling them the steps. If you’re interested in learning more about how to build a contact center forecast in Excel, let me know, and I will add your name to our waiting list for our virtual, two-day WFM Crash Course on Forecasting. But for now, good luck with your own forecasting efforts!

")