

Every year after the start of the 2nd quarter, I begin preparing next year’s staffing models in anticipation that someone on the executive team will ask for them because they’re thinking about next year’s budget plans. They need a WFM staffing model that shows required headcount in order to justify those payroll dollars in the annual budget meetings.
There is always a question about relativity when comparing annual numbers in a month-over-month view. People need to be reminded that March doesn’t have the same number of days as April. And June has the same number of days as April, but it doesn’t have the same number of weekdays. And even if it did, June this year doesn’t have the same number of weekdays as June will next year. Since Monday may have a higher volume than Thursdays, it’s important to know where every single one of these 365 days will fall on the calendar.
I always expect December and January to be rocky because of the heavy holidays that occur during those months, but the year 2016 is even a little more exaggerated than what I normally see, due to the fact that 2016 is a Leap Year, and 2015 has a bizarre situation with 4th of July falling on a Saturday. That’s why a chart like the one below can be a great visual tool to have on hand—before you get cornered by people who need an explanation about why you decided to suddenly increase next August’s forecast by +9%.
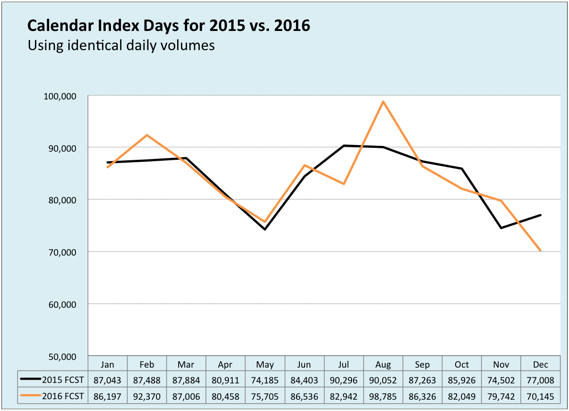
The black line represents the current year, 2015, and the orange line is next year’s monthly volumes. Both years have been completely calibrated to reflect identical daily volumes with no growth factors at all and with the corresponding year’s holiday factors, so these two lines demonstrate the true, unadjusted impact of the calendar for a group that is open Monday through Friday. The same idea also applies for a 7-day operation, but you’ll just see a lesser gap between the two years. It’s basically saying that, if the calls that were forecasted in 2015 arrived on the calendar dates in 2016, this is how the monthly volumes would turn out. For this group’s normal day-of-week arrival patterns, August 2016 does legitimately deserve +9% more than it has in the current year. Calendar days.
When you’re working with people outside of your WFM team, showing them this chart first can help to set a mental expectation that prepares them to more easily accept the other charts to come afterward, which will include the forecasting differences and eventually the staffing difference.
UPDATE: I’ve received a few requests to demonstrate the calendar index days’ impact for 2016 vs. 2017. The noticeable flip-flop occurs strongest in April-May 2017, but is also showing up a little in late summer and early fall months, as well. Since 2016 was a leap year, and Feb. 29th happened on a Monday of all days, the flip-flop will also be noticed in February, too, because 2017 has less weekdays than the year before. Below is an updated chart to help in your explanation how nature first affects 2017 call volume without regard to growth rates, declining trends, or any other call drivers.


")